Climate Geology
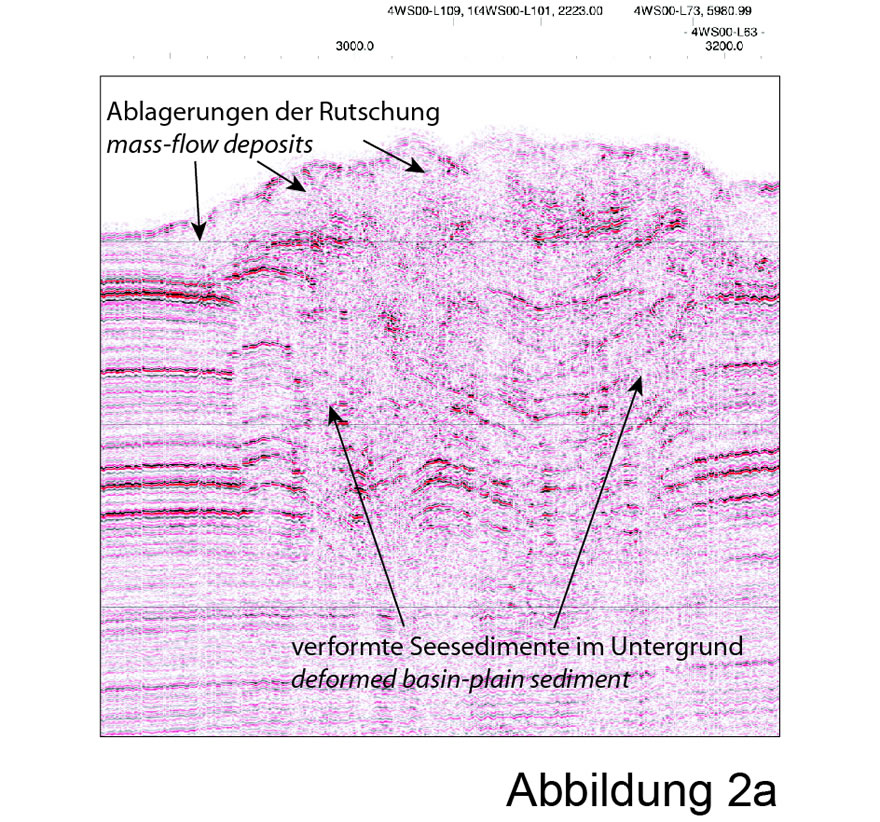
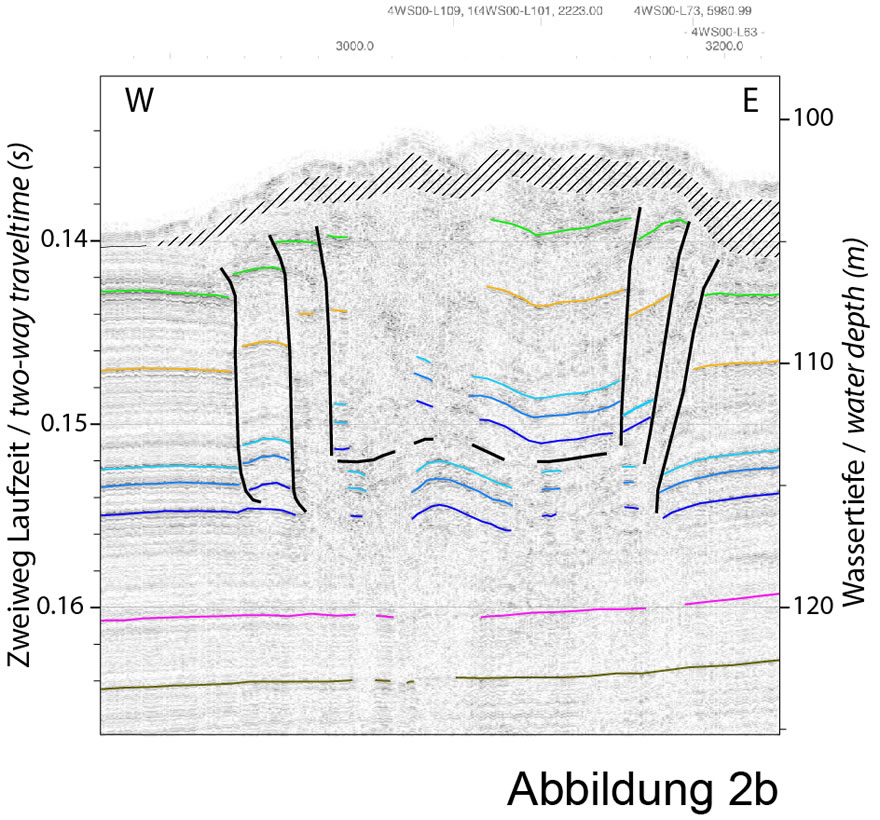
Figures 2a and 2b show the interpretation of the seismic profile. The data are derived from sound waves reflected at structures in the ground. Black lines denote faults, coloured lines different seismic horizons (stratigraphy; figure 2b).
We study climate changes through Earth's history and the correlations between carbon cycle, climate and the evolution of live. Sedimentary sequences thereby serve as an ideal archive for the past changes of the climate.
